
PKB Solutions logo

Working with us

Start with a scoped conversation

Tell us the outcome you are chasing and we will map it to a realistic first phase.

Contact the team
PKB Solutions logo
Home

Expansion Modules

Application Experience

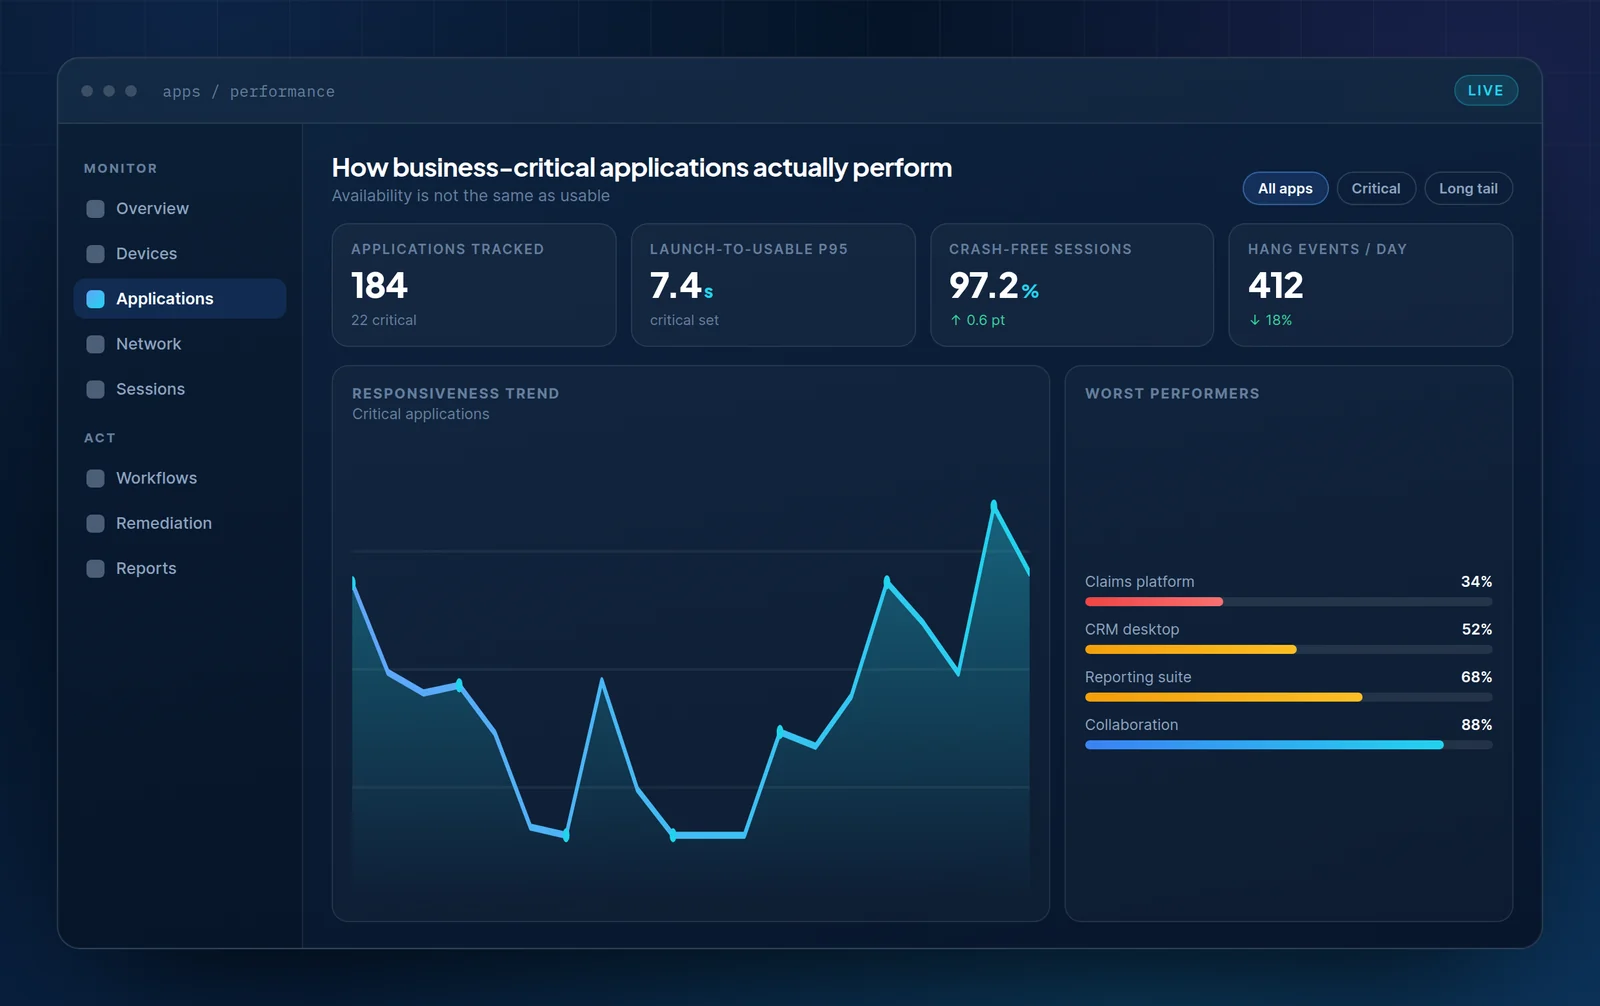
An application can be available, monitored and green while being genuinely unpleasant to use. This module measures the second thing.

PKB Application Experience dashboard tracking 184 applications with launch-to-usable time, crash-free session rate and the worst-performing applications.

What it covers

Availability and usability are different measurements

Server-side monitoring can tell you an application responded. It cannot tell you that it took eighteen seconds before anyone could type into it.

Launch to usable

Not launch to window drawn. The measurement ends when the application is genuinely ready for input.

Crash and hang attribution

Failure rates segmented by version, configuration and hardware generation rather than reported fleet-wide.

Resource cost

What each application costs the device it runs on, which is often why something else on the same machine is struggling.

Add-in impact

Plug-ins and extensions measured separately, because they are a frequent cause and a rare suspect.

Capabilities

Discover key features

Enough detail to name a version and a cohort, which is what a fix requires.

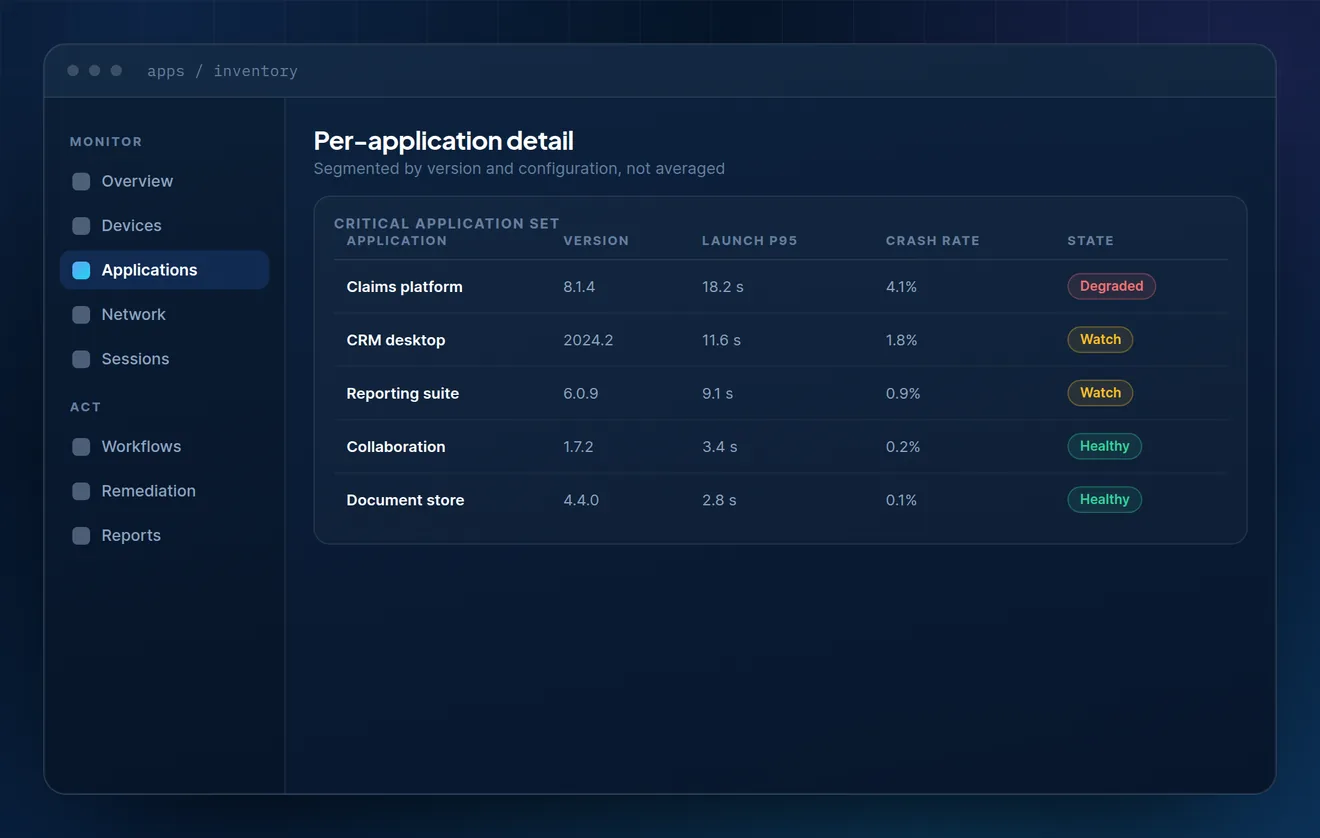
Critical application table listing version, launch time at the 95th percentile, crash rate and health state for five business applications.
01

Inventory

Per-application, per-version detail

The critical set is measured individually. An average across 184 applications is a number that describes nothing in particular.

  • Launch time and crash rate per application version
  • Critical set defined by role, not by install count
  • Long tail tracked separately from the critical set
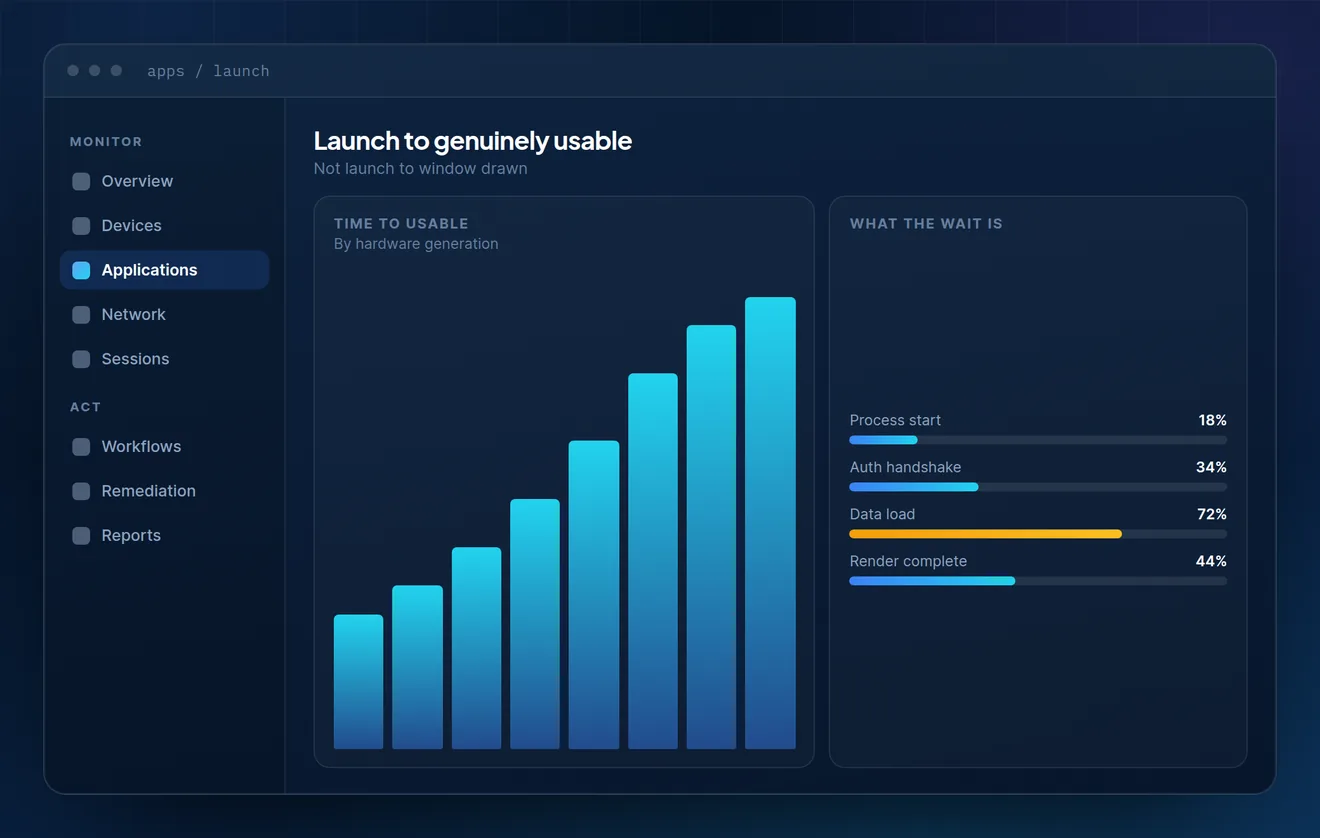
Time-to-usable comparison across hardware generations with a breakdown of process start, authentication, data load and render phases.
02

Launch

What the wait actually consists of

Process start, authentication handshake, data load and render are timed separately. Usually one of them accounts for most of the delay, and it is rarely the one assumed.

  • Four launch phases timed independently
  • Compared across hardware generations
  • Backend contribution separated from local cost
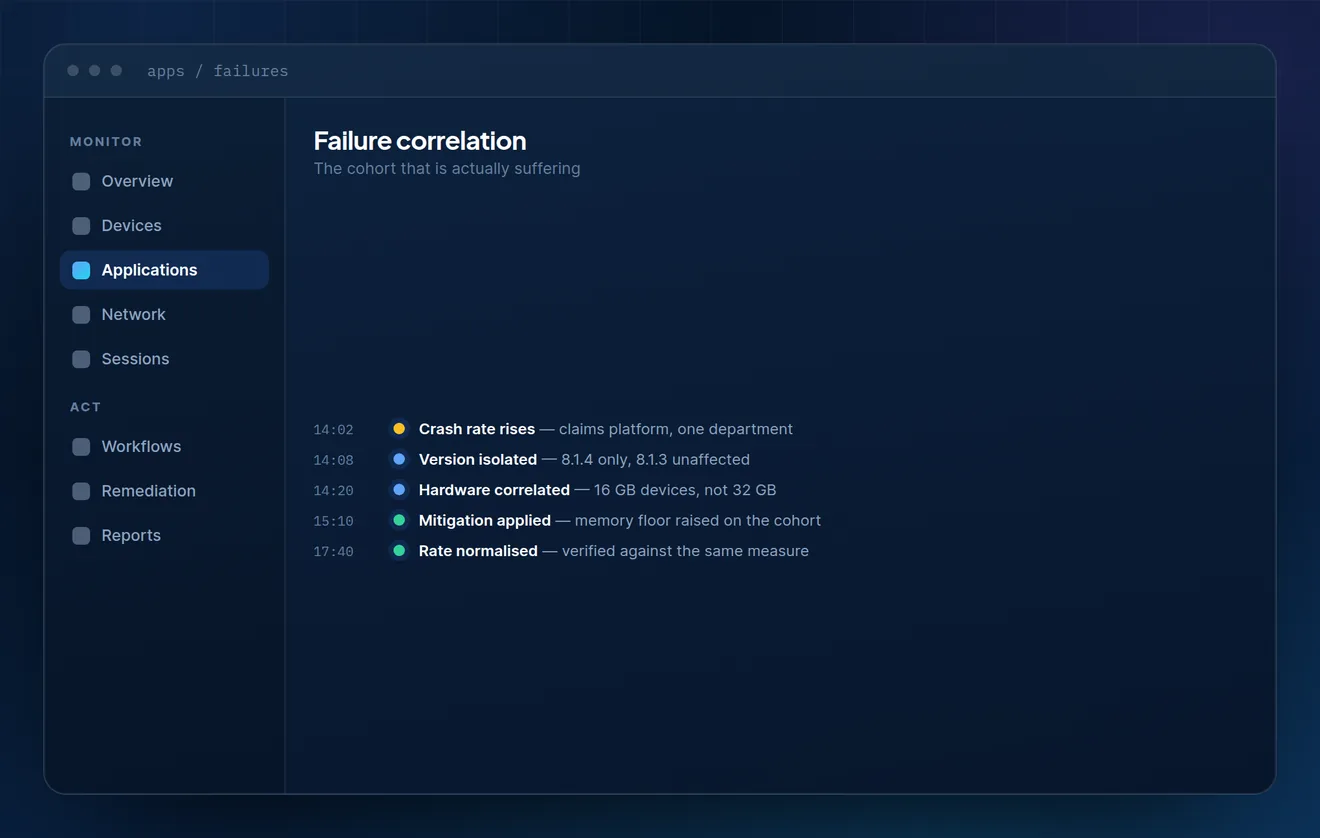
Failure correlation timeline from a rising crash rate through version and hardware isolation to an applied mitigation and normalised rate.
03

Failures

Correlated to a cohort, not a department

A crash spike becomes actionable the moment you can say which version, on which hardware, in which configuration. Until then it is a complaint.

  • Version and hardware correlated automatically
  • Memory and resource conditions at failure recorded
  • Mitigation verified against the same measure

Scope

What is measured, and what it needs from you

Application measurement requires a definition of which applications matter to which roles. That is a business decision, not a technical one.

What is measured, and what it needs from you
MeasurementAvailable out of the boxNeeds configurationWhy
Launch and responsivenessYesNoDerived from process behaviour
Crash and hang rateYesNoDerived from system events
Resource cost per applicationYesNoDerived from process metrics
Critical application setNoYesDepends on role definitions you own
Business transaction timingNoYesRequires an in-application marker
Add-in attributionPartialYesDepends on the application’s own model

Bring your worst-performing application

Pick the one that generates the most complaints and the least evidence. That is the useful demo.