

PKB Solutions logo

Working with us

Start with a scoped conversation

Tell us the outcome you are chasing and we will map it to a realistic first phase.

Contact the team
PKB Solutions logo
Home

AI Agents

Spark

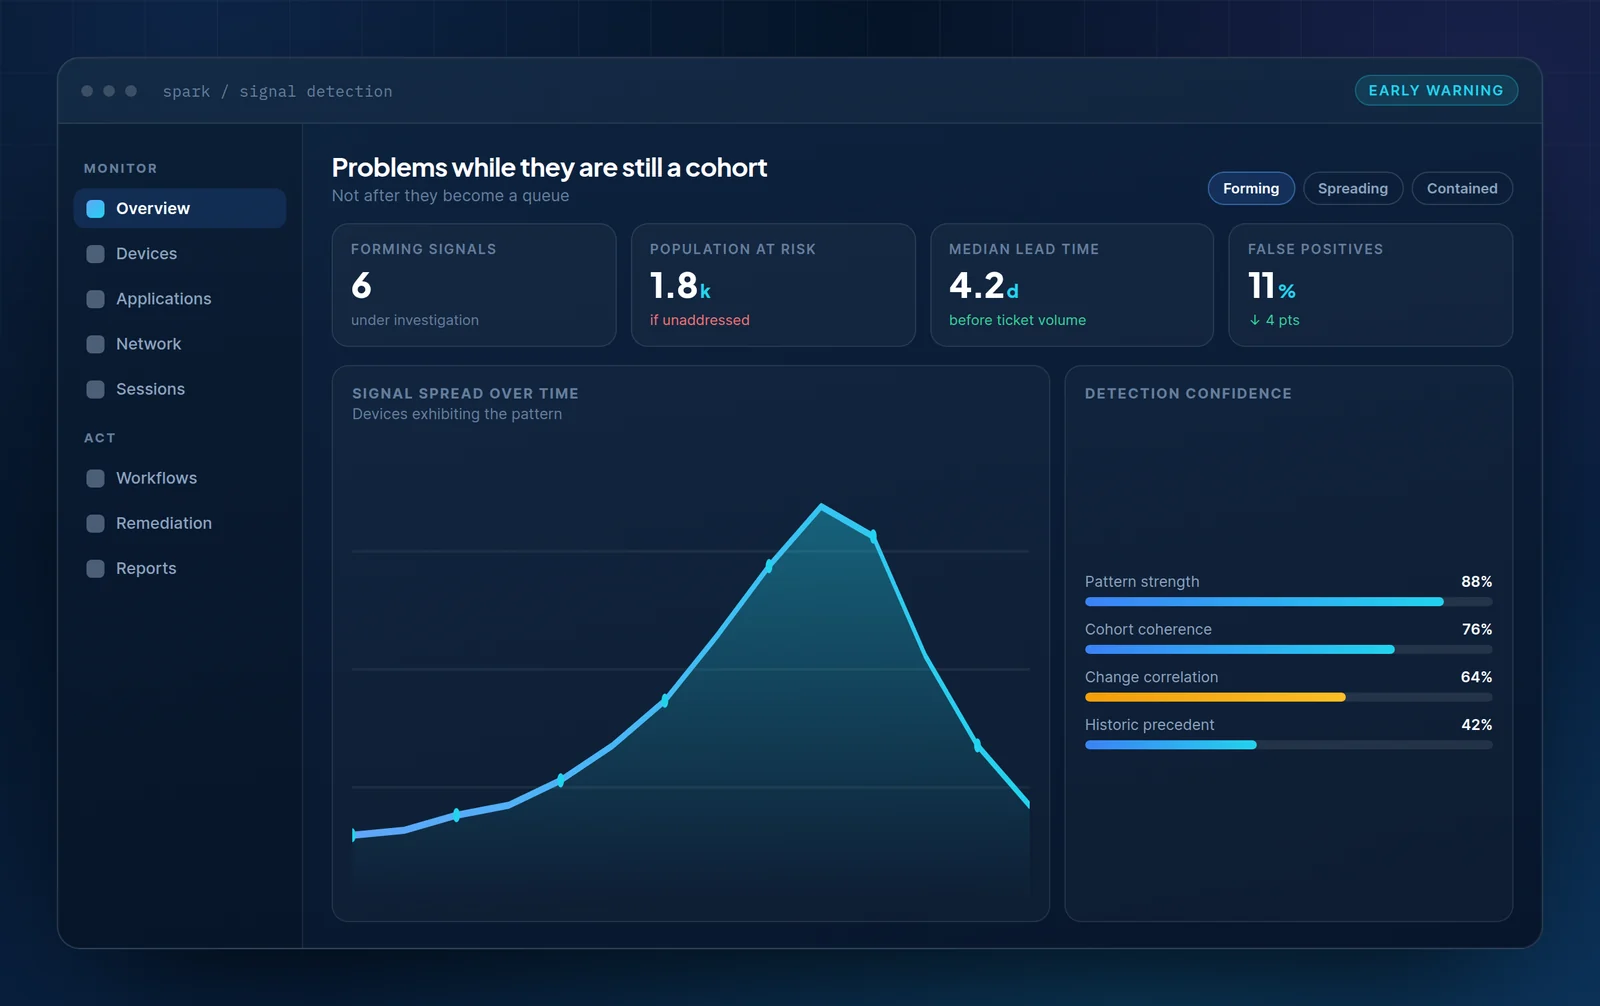
By the time a threshold breaks, the problem has usually already spread. Spark looks for the shape of a problem forming, not the moment it becomes an incident.

PKB Spark dashboard showing six forming signals, population at risk, median lead time and a chart of signal spread over time.

What it covers

Detection before there is anything to alert on

Threshold monitoring answers “is this bad yet?”. Spark answers “is this becoming bad, and for whom?” — which is a different question with a different answer.

Population drift

Gradual movement across a group of devices, which no individual device threshold would ever catch.

Cohort coherence

Whether affected devices actually share attributes, which is what separates a real signal from coincidence.

Change correlation

Deployments, patches and policy changes overlaid, so the likely trigger is visible immediately.

Spread modelling

How far the pattern would reach if nothing changed, modelled against the estate topology.

Capabilities

Discover key features

Three views that turn a faint pattern into something a team can be assigned to.

Anomaly timeline from a stable baseline through first deviation and pattern coherence to accelerating spread and containment.
01

Timeline

What changed, and when it started

The signal is anchored to the change that most plausibly caused it, so the investigation starts from a hypothesis instead of from scratch.

  • First deviation recorded before any threshold breach
  • Pattern coherence tracked day by day
  • Containment point recorded for the post-incident review
Cohort definition table listing shared attributes such as hardware model and OS build with coverage percentage and significance rating.
02

Cohorts

A signal without a cohort is just noise

Attribute coverage is scored, so you can see immediately which shared characteristics are meaningful and which are coincidence.

  • Coverage percentage per shared attribute
  • Significance rated, not just reported
  • Non-significant attributes shown so they can be dismissed
Propagation diagram showing a signal spreading from an origin build through two sites and a shared image, with fleet-wide and contained outcomes.
03

Modelling

How far it would have gone

Spread is modelled against the topology of the estate — shared images, sites and deployment rings — which is what turns “we caught it early” into a number.

  • Projected reach if no action were taken
  • Propagation path through shared images and rings
  • Containment point recorded against the projection

In practice

Nine days that did not happen

A worked example of the pattern most estates will recognise, written to explain the method.

A deviation with no alert

Forty devices begin taking eleven seconds longer to reach a usable desktop. No monitoring threshold is anywhere near breaching.

The pattern coheres

Over two days the affected set grows and the shared attributes sharpen: one hardware model, one OS build, two sites.

The change is correlated

A security agent version was deployed to exactly that ring on the day the deviation began.

Containment

A configuration change is piloted on fifty devices, measured, then applied to the remaining cohort. It never reaches the other 3,800.

Spark anomaly timeline showing the progression from stable baseline to contained signal.

Point it at your last avoidable incident

Tell us about something that grew quietly before anyone noticed. That is the shape of problem this is built for.