


Building a DEX baseline that survives its first review
A measurement model is only useful if it holds up when someone senior asks how the number was produced.
Platform tour
See the architecture end to end
Collection, correlation, analysis and action — laid out as one interactive model you can step through.
Where to start
Not sure which outcome to target first?
Walk through the digital friction explorer and see which problems map to which solution.
Featured guide
Building a DEX measurement baseline
A practical framework for defining, scoring and reporting digital employee experience.
Working with us
Start with a scoped conversation
Tell us the outcome you are chasing and we will map it to a realistic first phase.

Digital Employee Experience
Most IT teams can prove a service is up. Far fewer can prove it works well for the person using it. PKB Solutions closes that gap — measuring devices, applications and workflows from the employee's side, then turning what it finds into action.
Industry Examples





The problem
A slow boot, a crashing add-in, a saturated VPN tunnel — none of these trigger an outage alert, and most never become a ticket. They quietly consume minutes across thousands of people. Select a friction type to see how it forms and what evidence resolves it.
Boot and logon duration is one of the few experience metrics an employee measures themselves, every single morning. It also degrades gradually, which is exactly why threshold-based monitoring misses it.
Frequency across a typical fleet
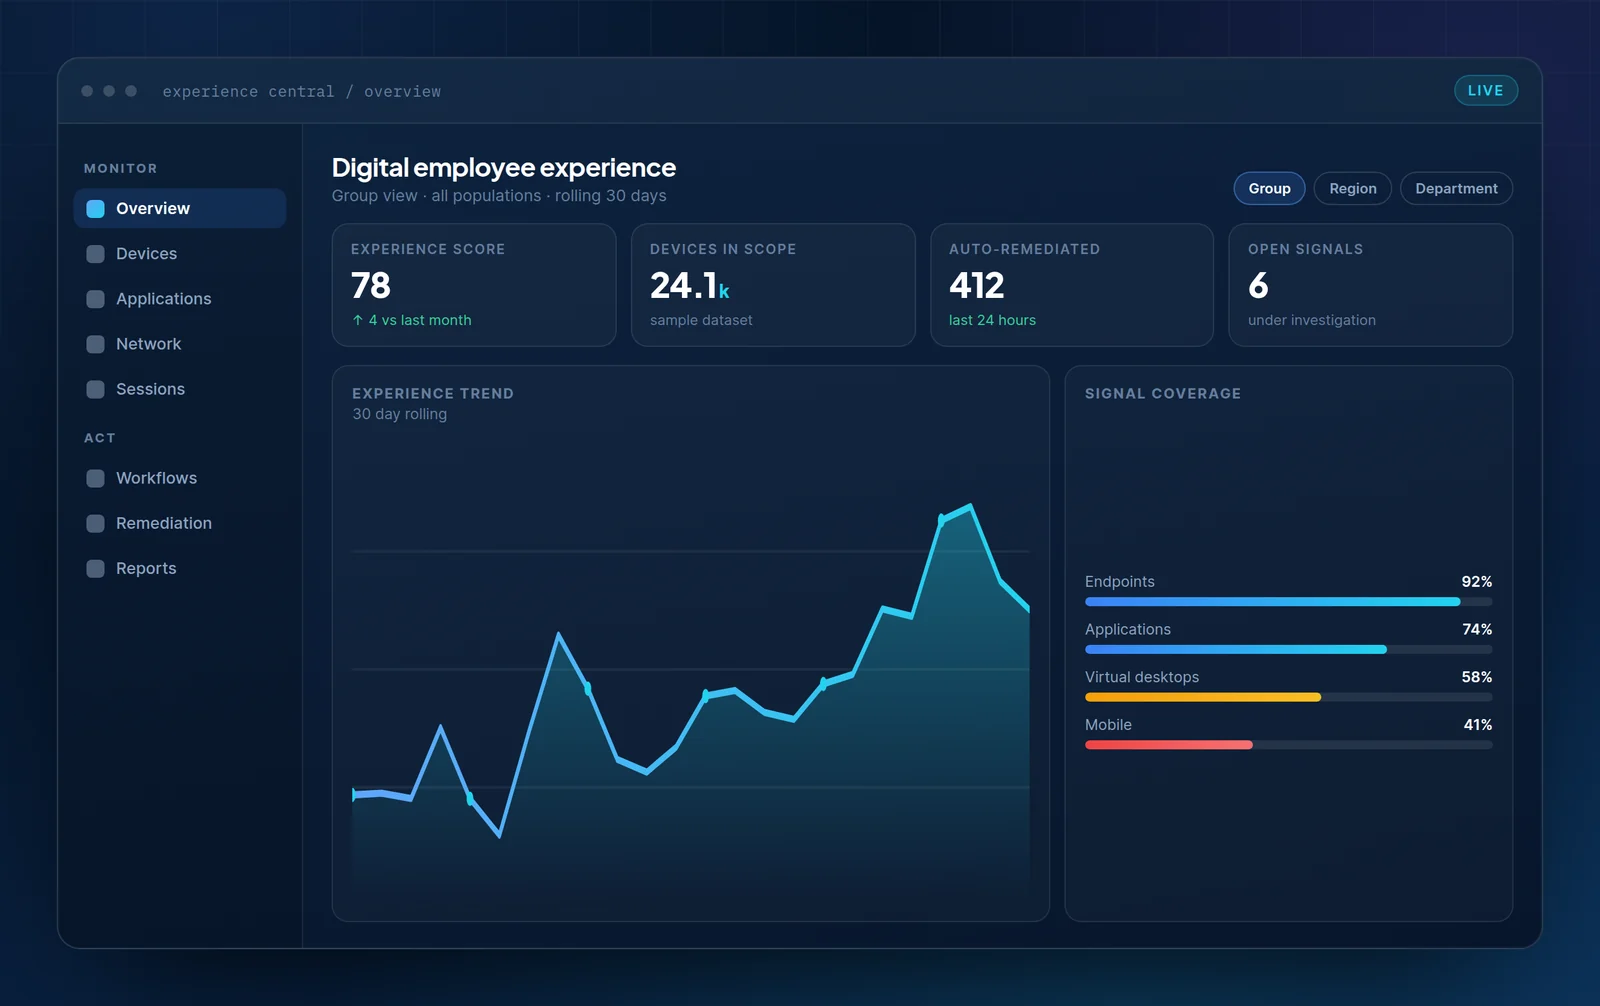
Experience score based on key digital workplace signals, including device performance, application responsiveness, network health, and user experience.
Compare against the fleet baseline, isolate the contributing phase, and target the specific build or policy — instead of replacing hardware on a hunch.
A crash rate that looks acceptable in aggregate is often severe inside one department, one version, or one hardware generation. Averages hide the population that is actually suffering.
Share of avoidable service desk contact
Experience score based on key digital workplace signals, including device performance, application responsiveness, network health, and user experience.
Segment by version and configuration to find the true cohort, then pilot the fix on that cohort before a fleet-wide change.
Connectivity is where hybrid work fails first. The connection is technically "up" while meeting quality, file sync and SaaS responsiveness are unusable.
Impact on collaboration workloads
Experience score based on key digital workplace signals, including device performance, application responsiveness, network health, and user experience.
Separate site problems from home problems from provider problems, so the fix lands with the team that can actually act on it.
Refresh cycles based purely on device age either replace healthy machines early or leave struggling ones in service. Neither is defensible to finance.
Correlation with low experience scores
Experience score based on key digital workplace signals, including device performance, application responsiveness, network health, and user experience.
Rank devices by measured strain rather than purchase date, and build a refresh list you can put in front of a budget holder.
The platform
Collection without correlation produces noise. Analysis without action produces reports. Step through each layer to see what it does and what it hands to the next.
A single lightweight collector reports device, session, application and network state on a fixed interval, with local buffering when a machine is offline. Nothing depends on the employee reporting a problem.
Sampling intervals and payload sizes are tuned so collection never becomes the performance problem it is meant to detect.
Operational telemetry only. What is collected, retained and excluded is documented in the Trust Center.
Buffered locally and reconciled on reconnect, so remote and travelling users are not blind spots.
Raw signals only become useful when they share a clock and an identity. Correlation joins endpoint state, application behaviour, network conditions and change events into a single sequence you can read.
A crash, a driver update and a VPN switch stop being three unrelated facts.
Group by department, location, hardware generation, OS build or any attribute that matters.
Link experience shifts to the deployment, policy or configuration change that preceded them.
An experience score is only useful if a sceptical stakeholder can see how it was calculated. Every score decomposes into the measured components behind it, with the population and time window stated.
Drill from a score to the exact metrics, weights and thresholds that produced it.
Surface gradual degradation that never breaches a static threshold.
Order candidate fixes by the number of people affected and the time recovered.
Detection without remediation just relocates the work. Actions run against a defined population, with approval gates where you need them, and the same measurement confirms whether the change worked.
Run a fix against exactly the affected cohort, not the whole estate.
Chain checks, actions and notifications into repeatable, auditable workflows.
Re-measure after the action and keep the before-and-after on record.
The verified outcome of every action feeds the next measurement cycle.
Experience map
Experience is not one number at one moment. It is the accumulation of every interaction between a person and the technology they were given.
Boot, logon, profile load and security checks before any work begins.
Launch time, responsiveness and stability of the tools the role depends on.
Meeting quality, screen sharing and file sync across networks you do not control.
Updates, patches and migrations landing mid-day on a live workforce.
Whether the issue was self-resolved, ticketed, or silently endured.
Composite experience score based on key device, application, network, and digital workplace performance indicators.
A single number is what gets a digital workplace programme funded — and the first thing a sceptical stakeholder will challenge. So the score is never the end of the conversation. Every point decomposes into the measurements behind it: which population, which time window, which thresholds, and what changed since the last reading.
That transparency is what separates an experience metric that survives a steering committee from one that quietly stops being reported after two quarters.
How the scoring model worksSolutions
Each of these is a defined programme with its own baseline, its own success measure and its own reporting.
Automation
The value of detection is realised only when something happens next. This is a representative workflow — detect a condition, confirm the scope, act on exactly the affected population, then verify.
Disk pressure crosses the sustained threshold on a group of devices.
Cohort validated against exclusions, change freezes and ownership.
Cleanup executes with the employee notified, not interrupted.
Re-measured after the run; unresolved devices escalate automatically.
Use automated workflows to identify issues, apply the right remediation, and verify results. PKB helps IT teams simplify recurring tasks while improving visibility, consistency, and the overall digital employee experience.
Industries
Same platform, different first problem. Select a sector to see where experience programmes usually begin.
Trading desks, branch estates and heavily regulated change control. Latency and evidence both matter — and both have to be provable after the fact.
Deploy to a representative population and measure for a full business cycle before changing anything.
Define which measures count, how they are weighted, and who signs off the definition.
Pick a single friction source with a clear owner, fix it, and report the before-and-after.
Mixed-age estates, long procurement cycles and strict data residency. The realistic goal is extending life and reducing avoidable support load.
Deploy to a representative population and measure for a full business cycle before changing anything.
Define which measures count, how they are weighted, and who signs off the definition.
Pick a single friction source with a clear owner, fix it, and report the before-and-after.
Shared clinical workstations, roaming sessions and no tolerance for a slow logon at the point of care.
Deploy to a representative population and measure for a full business cycle before changing anything.
Define which measures count, how they are weighted, and who signs off the definition.
Pick a single friction source with a clear owner, fix it, and report the before-and-after.
Highly technical users, heavy local workloads and rapid tooling change. Developer experience is a retention issue, not just an IT metric.
Deploy to a representative population and measure for a full business cycle before changing anything.
Define which measures count, how they are weighted, and who signs off the definition.
Pick a single friction source with a clear owner, fix it, and report the before-and-after.
Distributed teams, high device turnover and utilisation pressure. Every lost hour is directly billable.
Deploy to a representative population and measure for a full business cycle before changing anything.
Define which measures count, how they are weighted, and who signs off the definition.
Pick a single friction source with a clear owner, fix it, and report the before-and-after.

How we work
Digital employee experience attracts a lot of confident claims. We would rather be specific about what a measurement means, what it does not prove, and what you would need to observe before acting on it.
Our guidance comes from running measurement programmes on real estates — including the parts that did not work first time.
Every concept we publish is explained from fundamentals: what it is, why it exists, when to use it and when not to.
Data handling, retention and security posture are documented and versioned in the Trust Center.
We publish customer names, metrics and outcomes only where the customer has verified them.
Resources
 Guide
A measurement model is only useful if it holds up when someone senior asks how the number was produced.
 Insight
Aggregation is the most common reason a real problem stays invisible for two quarters.
 Article
What has to be true about your telemetry before "proactive" means anything operationally.
Common questions
The questions we are asked most often, answered plainly. The full set is on the FAQ page.
All FAQsNext step
Tell us which part of the employee technology experience is costing you the most right now. We will show you what the platform would measure, what it would not, and what a realistic first phase looks like.