

PKB Solutions logo

Working with us

Start with a scoped conversation

Tell us the outcome you are chasing and we will map it to a realistic first phase.

Contact the team
PKB Solutions logo
Home

Infinity Platform

Mobile Experience

Field and frontline workers are the least likely people in your organisation to raise a ticket, and the most likely to be working on a degraded device.

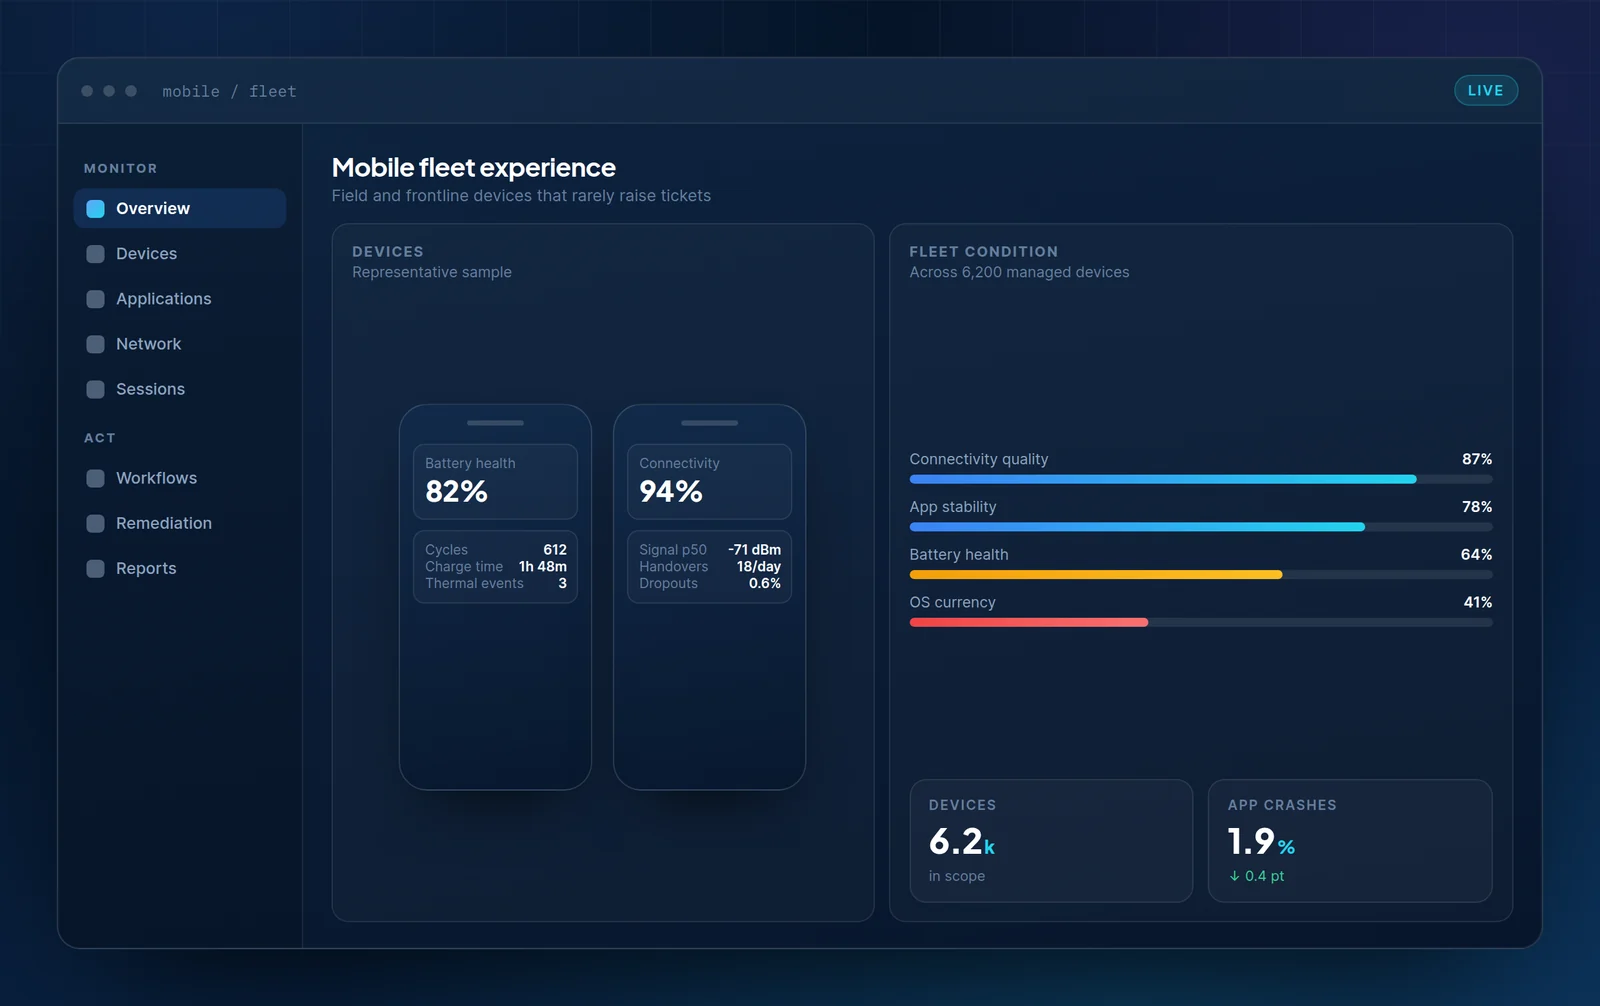
PKB Mobile Experience view showing device battery health and connectivity panels alongside fleet-wide condition meters across 6,200 managed devices.

What it covers

The population that never complains

Low ticket volume from a mobile fleet is usually not evidence that it is working. It is evidence that raising a ticket is inconvenient when you are on a forklift or in a customer’s house.

Connectivity quality

Signal strength, handover behaviour, dropouts and carrier conditions — measured by role and location, not fleet-wide.

Application behaviour

Crash and hang rates correlated with app version, OS build and available memory rather than reported in aggregate.

Battery and thermal health

Capacity against original specification, charge cycles and throttling events, so replacement can be planned rather than reactive.

Compliance drift

OS currency, patch level and configuration drift across a fleet that is rarely on a corporate network.

Capabilities

Discover key features

Built for fleets where the user is unlikely to tell you anything is wrong.

Connectivity table comparing signal strength and dropout rate across field engineer, warehouse, retail floor and corporate populations.
01

Connectivity

Signal quality by role, not by fleet

A fleet-wide median hides the field engineers entirely. Grouping by working population is what makes the problem visible and gives it an owner.

  • Field, warehouse, retail and corporate measured separately
  • Dropouts distinguished from weak-but-usable signal
  • Location patterns surfaced without tracking individuals
Chart of mobile application crash rate by app version with contributing-factor meters for app version, OS build, low memory and background refresh.
02

Applications

Crashes attributed to a version, not a vibe

Crash rate on its own is a number nobody can act on. Correlated with app version, OS build and memory pressure, it becomes a specific change with a specific owner.

  • Per-version crash rate over a rolling window
  • OS build and low-memory conditions correlated
  • Background refresh behaviour accounted for
Battery health grid across eight device cohorts with a forecast chart of devices crossing the sixty percent threshold.
03

Hardware

Battery replacement you can forecast

Battery health degrades predictably. Measured across cohorts, it turns an unplanned support cost into a scheduled line in next quarter’s budget.

  • Capacity against original specification per cohort
  • Forecast of devices crossing the replacement threshold
  • Thermal throttling recorded alongside charge behaviour

Privacy

Where the line sits on a personal-feeling device

Mobile is the point where experience measurement is most likely to be mistaken for surveillance, so the boundary has to be explicit and enforced in the product rather than in a policy document.

  • Device and application state only, never content or location history
  • Personal applications excluded from collection entirely
  • BYOD profiles collect a reduced set, documented separately
  • What is collected is visible to the employee, not just to IT

Say it before you are asked

A mobile programme that the workforce does not trust will be worked around, and the data you collect after that point is not worth much. The collection scope is published and configurable before deployment.

Start with your least visible population

Field service, warehouse or retail — whichever group you hear from least is usually where the measurement pays back first.