

PKB Solutions logo

Working with us

Start with a scoped conversation

Tell us the outcome you are chasing and we will map it to a realistic first phase.

Contact the team
PKB Solutions logo
Home

Infinity Platform

Workplace Experience

Every managed device is producing evidence about the experience it delivers. Workplace Experience collects it, makes it comparable across the fleet, and turns it into a ranked list of things worth fixing.

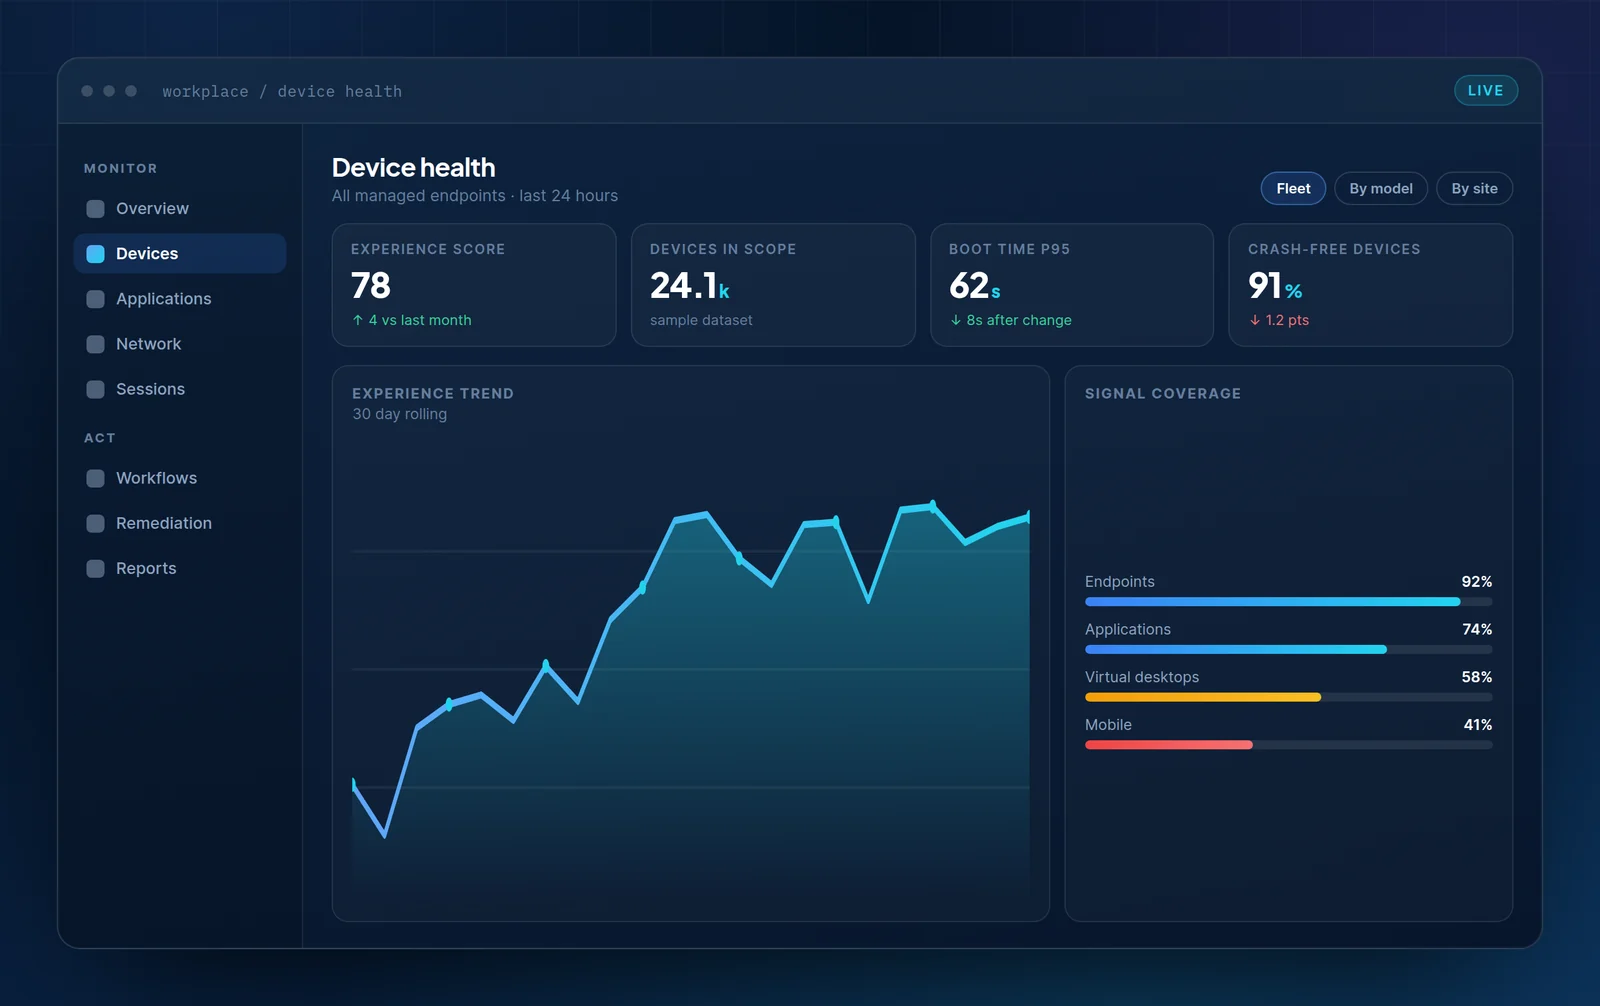
PKB Workplace Experience dashboard showing device health, an experience score of 78, boot time at the 95th percentile and signal coverage across the fleet.

What it covers

Four signal domains, one device record

Each domain is measured continuously and stored against the same device identity, so a symptom in one can be explained by a condition in another.

Hardware condition

Memory and CPU headroom under real workloads, disk health and free space, battery wear, and thermal throttling events.

  • Sustained resource saturation, not instantaneous spikes
  • Storage health indicators ahead of failure
  • Battery capacity against original specification

Operating system state

Boot and logon phase timing, patch level, driver versions, service health and configuration drift against the intended build.

  • Boot decomposed into its contributing phases
  • Drift between intended and actual configuration
  • Update success, failure and rollback history

Application behaviour

Launch time, responsiveness, crash and hang events, and resource cost of the applications the role actually depends on.

  • Per-version and per-configuration failure rates
  • Time from launch to genuinely usable
  • Add-in and extension impact

Local network conditions

Wi-Fi signal quality, roaming behaviour, VPN tunnel characteristics and response times to the services being used.

  • Quality, not just connectivity state
  • Home, office and client-site separation
  • Correlation with collaboration quality

Capabilities

Discover key features

The three surfaces an endpoint team spends most of its week in.

Fleet inventory ranked by measured strain, with a refresh candidate table comparing time in service against median strain.
01

Inventory

Rank the fleet by strain, not by purchase date

Age-based refresh replaces healthy machines and keeps struggling ones in service. A strain-ranked list is a different conversation with finance, because it comes with evidence attached.

  • Devices scored on sustained measured load
  • Refresh candidates separated from memory-upgrade candidates
  • Recommendation attached to each cohort, not each device
Logon duration chart across twelve weeks with a configuration change marked, alongside phase-by-phase timing meters.
02

Boot decomposition

Logon time broken into the phases that cause it

Boot and logon degrade gradually, which is exactly why threshold monitoring misses them. Decomposed into phases, an eleven-second drift becomes one named contributor.

  • Security agent, profile, policy and shell timed separately
  • Change events overlaid on the twelve-week window
  • Cohort compared against the fleet baseline
Remediation run timeline from condition matched through cohort validation and approval to completion and verified outcome.
03

Remediation

Fix the cohort, then prove the fix landed

Every run records the population, the approval and the outcome, and the same measurement confirms whether the condition actually cleared.

  • Scoped to the affected cohort, never the whole estate
  • Approval gates where change control requires them
  • Devices that did not improve escalate automatically

Why it is different

Availability monitoring and experience measurement answer different questions

Both are necessary. Confusing one for the other is how estates end up green on every dashboard while people complain.

Comparison of availability monitoring and experience measurement across five dimensions
Dimension Availability monitoring Workplace Experience
Question answeredIs the service running?What is it like to use, for whom?
Vantage pointServer, service or network deviceThe endpoint the employee is sitting at
Failure modelBinary — up or downGradual — degradation and drift
Typical triggerThreshold breach or outageChange in measured experience across a population
Blind spotSlow but technically available servicesBackend capacity issues outside the endpoint

This comparison describes categories of tooling in general terms. It is not a claim about any specific vendor product.

In practice

How a single finding travels from signal to fix

A worked example, using a pattern most estates will recognise.

A drift, not an alert

Logon time on one hardware generation rises by eleven seconds over three weeks. No threshold is breached, so nothing fires.

The population is isolated

Segmentation narrows it to one model, on one OS build, in two locations — roughly 900 devices out of the fleet.

The phase is identified

Boot decomposition shows the increase sits entirely in a security agent's start-up phase after a version change.

The change is scoped and verified

A configuration change is piloted on 50 devices, measured, then rolled out to the remaining population and re-measured.

Logon time, one hardware cohort

Sample data — 12 week window

config change week 1 week 12
Devices in cohort0
Phase identifiedAgent start-up

Who it helps

The same data, read four different ways

Endpoint engineering

Prove which build, driver or agent version is responsible before scheduling a change — and confirm afterwards that it worked.

Service desk

Open a ticket already knowing the device state, recent changes and whether other people are affected.

Digital workplace leadership

Report experience movement to the business in terms a non-technical stakeholder can interrogate.

Asset and finance

Base refresh decisions on measured strain rather than purchase date, with the evidence attached.

Deployment

What it takes to get running

Workplace Experience deploys as a single collector alongside your existing management tooling. It does not require agent removal, and it does not need to be the system of record for anything.

  • Distributed through your existing software deployment channel
  • No change to endpoint management ownership or tooling
  • Phased rollout by population, starting with a representative pilot
  • Collection scope reviewed and agreed before the pilot begins

Data handling in plain terms

Experience measurement and employee monitoring are different things with different data needs. This product collects operational state — device, application and network conditions — not content, keystrokes or productivity scoring.

The full data inventory, retention settings and regional processing options are documented in the Trust Center, and the collection scope is configurable before deployment.

See Workplace Experience against your own estate

Bring a device population and a symptom you cannot currently explain. That is a more useful demo than a feature tour.